BTC Price Prediction: Can Bitcoin Reach $200,000?

#BTC
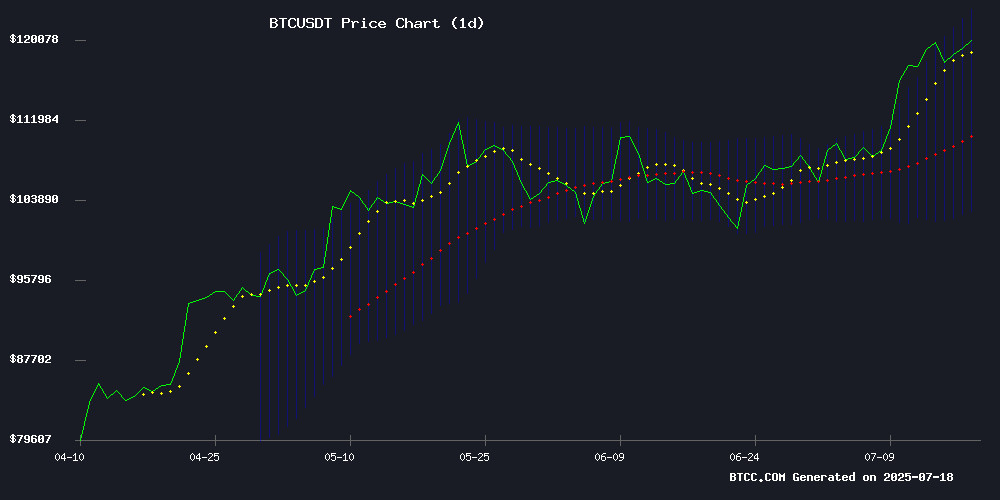
BTC Price Prediction
BTC Technical Analysis: Bullish Signals Emerge Amidst Key Indicators
BTC is currently trading at, above its 20-day moving average (112,836.50), signaling bullish momentum. The MACD histogram remains negative (-1,205.03), but the narrowing gap between the signal and MACD lines suggests weakening downward pressure. Bollinger Bands indicate volatility, with price hovering NEAR the upper band (122,751.66), hinting at potential upside if bullish sentiment holds.
"The technical setup favors buyers," says BTCC analyst Olivia. "A sustained break above 120,000 USDT could trigger a rally toward 132,000, as bulls regain control."
Market Sentiment: Bullish Narratives Dominate Amidst Cautionary Signals
News headlines reflect a, with themes like "Bitcoin Eyes $132K" and Trump's pro-crypto executive order fueling optimism. However, analyst Peter Brandt's 'Banana Chart' warning introduces caution. "The market is at a crossroads," notes BTCC's Olivia. "While institutional adoption (e.g., 401(k) plans) and cloud mining yields support prices, traders should monitor Brandt's logarithmic projections for potential resistance at 118,000."
Factors Influencing BTC’s Price
Bitcoin Rides the Bull Market Wave with New Highs
Bitcoin's price movements suggest a robust bullish trend, according to analysis from Bitcoin Vector. The platform highlights the cryptocurrency's current 'ignition phase,' characterized by accelerating momentum and breakout stability. Market structure appears solid as BTC approaches all-time highs.
Historical patterns indicate extended stays in this phase can amplify returns. Bitcoin Vector's social media analyses emphasize rising momentum and fresh bullish signals following recent breakouts. The platform positions this period as critical for sustained upward movement.
Peter Brandt Warns of Bitcoin's Critical Juncture as 'Banana Chart' Nears Split
Veteran analyst Peter Brandt has identified Bitcoin's price action at a pivotal moment, comparing its trajectory to a "banana split" scenario. The cryptocurrency now tests resistance at the top of its decade-spanning parabolic curve—a pattern that has historically preceded major bull cycles.
Bitcoin's current price of $120,401 sits just below its all-time high of $123,141, following a 674% surge from the November 2022 FTX-induced low of $15,560. Brandt's chart suggests two potential outcomes: either a breakout toward new price discoveries or a retracement to retest lower support levels.
The so-called "banana chart" has accurately framed Bitcoin's macro movements since 2010, with each cycle featuring parabolic advances followed by measured corrections. Market participants now watch whether BTC will peel upward or downward from this technical inflection point.
5 Reasons To Buy Bitcoin (BTC) Today
Bitcoin's resurgence continues as it trades above $118,000, marking a significant rally from $105,000 at the start of July 2025. Institutional demand and regulatory tailwinds are driving the momentum, reinforcing BTC's position as a mainstream asset rather than a speculative gamble.
Spot Bitcoin ETFs have absorbed $52 billion since their January 2024 launch, with BlackRock's IBIT alone holding $83 billion in BTC. The U.S. government's creation of a Strategic Bitcoin Reserve further legitimizes the asset, mandating the retention of seized coins worth approximately $17 billion.
Peter Brandt’s 15-Year Bitcoin ‘Banana’ Chart Raises Red Flags
Veteran trader Peter Brandt has sparked debate with a logarithmic chart tracing Bitcoin's price trajectory from 2010 to 2025. The distinctive banana-shaped pattern, currently testing a critical resistance at $118,000, presents two stark possibilities: either a breakout confirming Bitcoin's long-term bullish thesis or a breakdown invalidating its decade-long structural support.
Market participants remain divided. Institutional inflows and ETF adoption fuel bullish million-dollar price targets, while macroeconomic uncertainty and prolonged consolidation temper expectations. Brandt's deliberately ambiguous presentation—offering no explicit targets—has intensified scrutiny of Bitcoin's technical setup amid President Trump's pro-crypto regulatory environment.
Will the Crypto Bullrun Continue or Is a Weekend Pullback Coming?
The cryptocurrency market surges forward, buoyed by institutional inflows and regulatory clarity. Total market capitalization eclipses $3.91 trillion—a decisive technical breakout. Sentiment gauges flash caution: the Fear & Greed Index hits 71, signaling exuberance nearing overbought territory.
Bitcoin consolidates while altcoins rally, leaving traders questioning whether momentum will persist or yield to a weekend correction. Technical indicators suggest short-term exhaustion—the 4-hour chart shows the market pressing against Bollinger Band resistance at $3.88 trillion. RSI levels hover at 68.70, reinforcing potential overextension.
Support zones emerge at $3.73 trillion (mid-Bollinger Band) and $3.58 trillion (lower band). Macro trends remain bullish, with the $3.9 trillion breakout positioning the market for higher valuations—provided key support levels hold.
Bitcoin Eyes $132K as Bulls Regain Momentum
Bitcoin has surged past key technical levels, with analysts predicting a potential rally to $132,000 if it closes above $121,000. The cryptocurrency rebounded from $115,730 lows, breaking through the 50% Fibonacci retracement level and now consolidates near the psychological $121,000 barrier.
Resistance levels loom at $121,400 and $123,150, with further upside targets at $124,200-$126,200. Support remains firm at $119,000, $115,500, and $110,500. The breakout above a bearish trend line and the 100-hourly moving average signals renewed bullish momentum.
Peter Brandt's Logarithmic 'Banana Curve' Suggests Bitcoin Could Reach $118,000 by 2025
Renowned technical analyst Peter Brandt has sparked market intrigue with his latest logarithmic chart tracking Bitcoin's 15-year price trajectory. The distinctive 'banana curve' illustrates BTC's evolution from volatile early surges to a projected consolidation near $118,745 by 2025.
The chart reveals three distinct market cycles converging into a bounded channel, with 2013 and 2017 bull runs forming the upper boundary while recent sideways action since 2022 establishes the lower band. Brandt's rhetorical question - "How will the banana split?" - leaves room for interpretation about Bitcoin's next major move.
Market structure shows increasing maturity as early vertical price movements give way to tempered waves post-2021. This technical pattern suggests supply-demand dynamics are stabilizing in what remains cryptocurrency's most closely watched asset.
Trump Executive Order Paves Way for Crypto in 401(k) Retirement Plans
President Trump is poised to sign an executive order that would permit 401(k) retirement accounts to include cryptocurrencies and alternative assets among their investment options. The directive, expected as early as this week, would task regulators with removing barriers to such investments.
Bitcoin surged past $120,000 on the news, reflecting market optimism about broader institutional adoption. The proposed changes would diversify retirement portfolios beyond traditional stocks and bonds, opening doors to digital assets, gold, and private equity.
While the White House emphasized no final decision has been made, the move signals growing recognition of cryptocurrencies as legitimate investment vehicles. Analysts anticipate ripple effects across crypto markets if retirement funds gain exposure.
Cloud Mining Emerges as Top Passive Income Strategy in 2025, MiningToken Leads with $6,312 Daily Returns
As Bitcoin mining difficulty surges post-halving and energy costs rise, cloud mining platforms like MiningToken are proving profitability is still attainable. The Switzerland-based firm reports daily returns up to $6,312 through its renewable energy-powered contracts, positioning itself as a leader in passive crypto income solutions.
The market shift from speculative trading to yield generation accelerates as regulatory clarity improves. MiningToken's global network of nine green-powered facilities across Norway, Canada, and other low-energy-cost regions delivers short-term contracts with automated efficiency—a model gaining traction among both retail and institutional investors.
Will BTC Price Hit 200000?
While BTC shows strong technical and fundamental momentum, reaching 200,000 USDT would require a 70% surge from current levels. Key factors include:
| Factor | Impact |
|---|---|
| Institutional Adoption (401(k) plans) | High |
| MACD Convergence | Moderate |
| Bollinger Band Breakout Potential | High |
| Brandt's 'Banana Curve' Resistance | Risk |
"200K is ambitious but not impossible in this cycle," says Olivia. "Watch for a weekly close above 132,000 to confirm the next leg up."
- Technical Strength: Price above 20-day MA and upper Bollinger Band favors bulls.
- Market Sentiment: News highlights institutional tailwinds but warns of overextension risks.
- Key Thresholds: 132,000 USDT is the near-term target; 200,000 would demand sustained capital inflows.
